Viewing Reports
Reports are a very useful way for Clients to view their data. They can display data in very intricate and precise ways that mostly fit the Users needs. Each Report has a group of filters that can be set before running to help achieve this. This can all be done from within the Reports tab in the Ribbon menu.
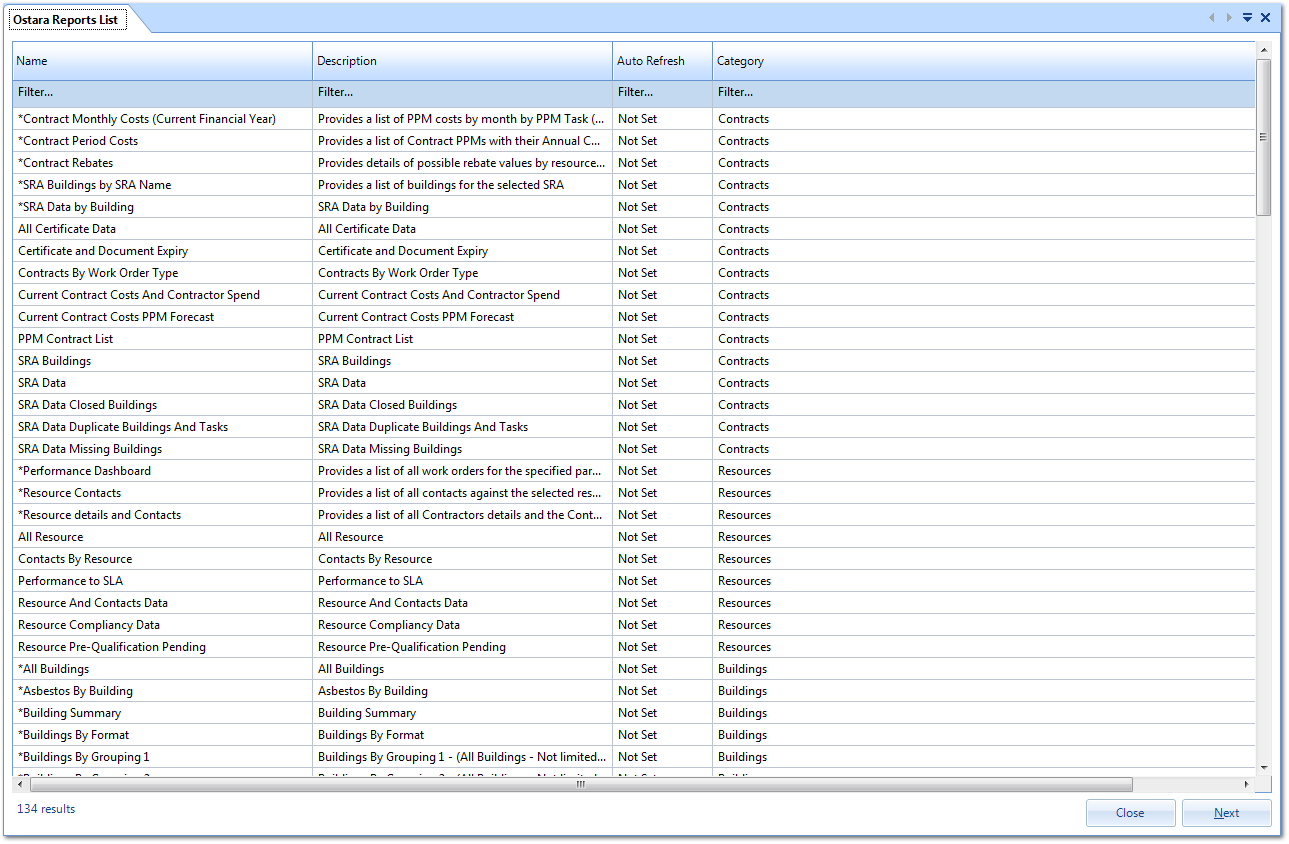
1. Click "Report Search" to display a list of all the Reports available. The list of Reports that are shown is dependant on which Reports the Profile the User is associated with has permission to view. Here is an example Report list:
- None: No restrictions apply. Any User running this particular report will see all data the report returns without restriction
-
UB: This report will only return results based on the User's Buildings-
R: This report will only return results based on the Resource the User is associated with. (If the User is not a Resource User this will have no impact)- RG: This report will only return results based on the Resource Grouping the User is associated with. (If the User is not associated to any Resource Groupings this will have no impact)
-
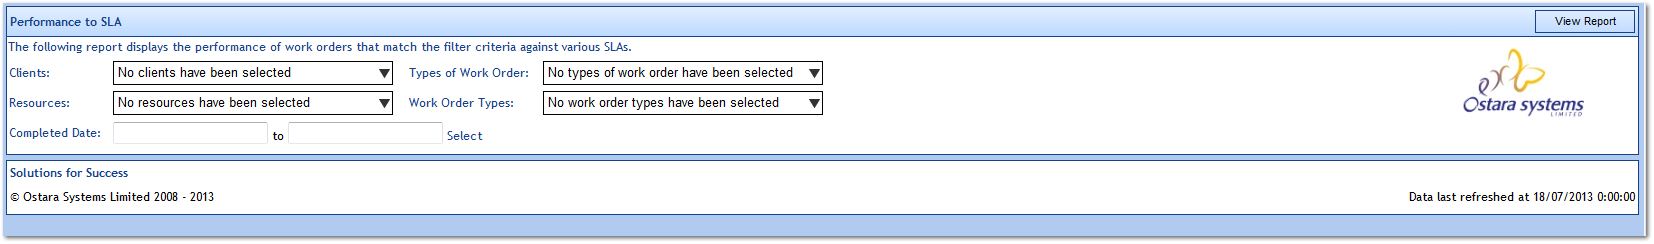
UW: This report will only return results based on the User's associated Work Order Types and Sub Work Order Types2. Double click a Report or select a Report and click "Next" to open it. Depending on the Report, it will either run straight away and display information on the preset filters or blank filters will be returned enabling the User to determine the parameters of what data is shown. At any time, it is possible to change the parameters so that different information is displayed. Once the parameters have been set, click "View Report" and the Report will be generated.
A typical report header with the available filters is as follows:
4. It is also possible to drill down further into the details of some Reports. These Reports will typically have links (these will be blue and underlined, or the cursor will change from an arrow to a hand) which will display the details specifically related to the area.
5. Once all the necessary tasks have been completed, close down the Report by clicking "Close".
Note: If the User's machine has Internet Explorer 9 or earlier installed, there may be unexpected results with some of the reports. A later version of Internet Explorer is required to run the reports from the main application. If the User does experience these issues, then it is recommended that they use the Web Portal to run the reports via another browser other than Internet Explorer.
Note: If the report is ever shown in a grey, it means that the databases containing the data used in the report have not been rebuilt yet and haven't gotten today's data. When they return back to white, this means that the data is up to date.
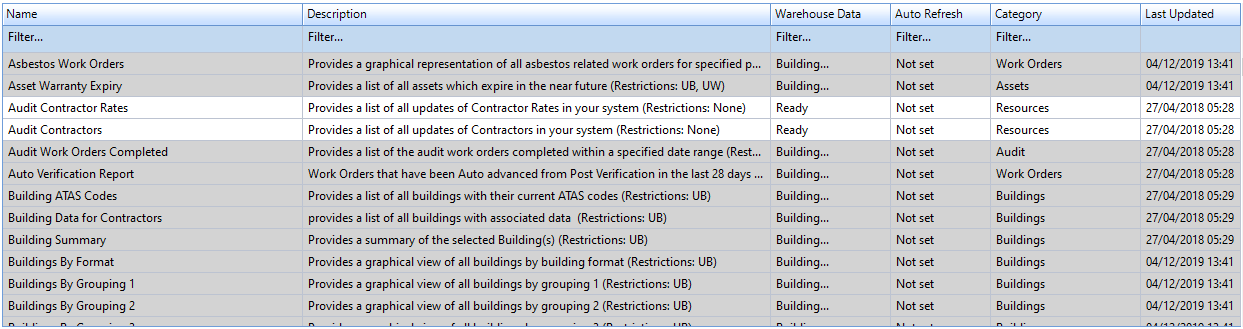
Note: If the report is ever shown in a grey, it means that the databases containing the data used in the report have not been rebuilt yet and haven't gotten today's data. When they return back to white, this means that the data is up to date.